


Annual Drinking Water Quality Report for 2015
Village of Montgomery Water System
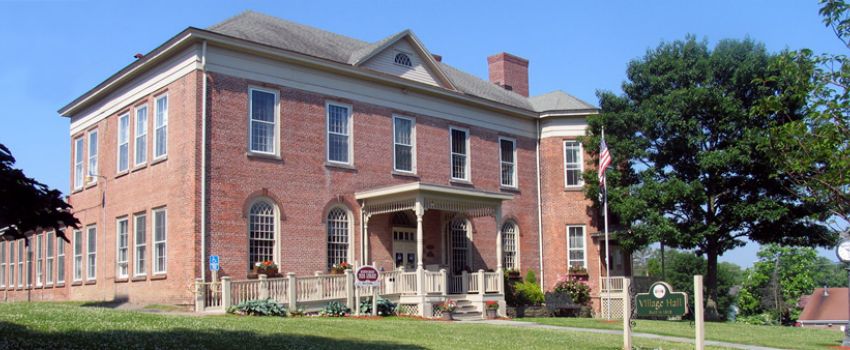
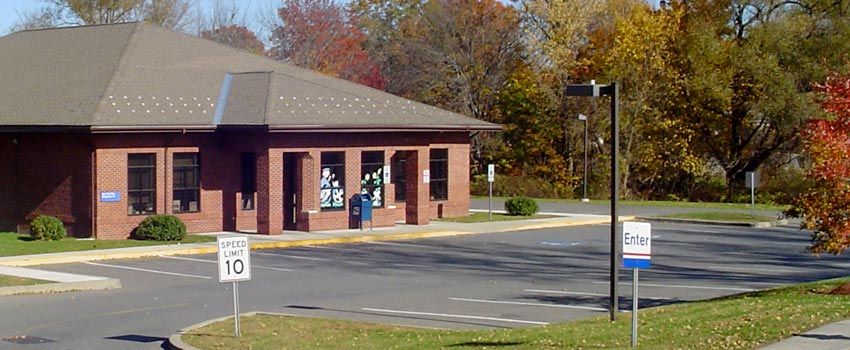
133 Clinton Street, Montgomery, NY
(Federal ID 3503542)
Testing of our water supply system is done to be sure the drinking water that the Village of Montgomery delivers to your home or business remains safe. The Department of Public Works will be flushing hydrants from April 11th – April 22nd 2016. Again, you will experience some brown water during this period. When the brown water occurs, run your water until it clears (usually about 5 minutes).
In the coming year, the Village will be installing a green sand filter system at our Holt Well location to eliminate the manganese problem(see attached table), with an estimated cost of about $500,000. Also this year, the Village will be replacing the water main on Clinton Street between Union Street and Wallkill Avenue. This will be done using a Community Development Block Grant of $100,000. Replacing this water main is being done to increase the available volume of water for fire protection and to update the aging infrastructure.
The NYS DOH has completed a source water assessment for this system based on available information. Possible and actual threats to the drinking water source were evaluated. The state source water assessment includes a susceptibility rating based on the risk posed by each potential source of contamination and how easily contaminants can move through the subsurface to the wells. The susceptibility rating is an estimate of the potential for contamination of the source water, it does not mean that the water delivered to consumers is, or will become contaminated. See “Table of Detected Contaminants” for a list of the contaminants that have been detected. The source water assessments provide resource managers with additional information for protecting source waters into the future.
As mentioned before, our water is derived from six drilled wells. The source water assessment has rated these wells as having a medium to high susceptibility to microbials, nitrates, industrial solvents, and other industrial contaminants. These ratings are due primarily to the close proximity of a SPDES permitted discharge facility (industrial/commercial facilities that discharge wastewater into the environment and are regulated by the state and/federal government), the low-level residential activity and the pasture that is located in the assessment area. In addition, the wells draw from fractured bedrock and various aquifers and the overlying soils may not provide adequate protection from potential contamination. While the source water assessment rates our wells as being susceptible to microbials, please note that our water is disinfected to ensure that the finished water delivered into your home meets New York State’s drinking water standards for microbial contamination. A copy of the assessment, including a map of the assessment area, can be obtained by contacting us, as noted in this report.
To comply with State and Federal regulations, the Village of Montgomery will be annually issuing a report describing the quality of your drinking water. The purpose of this report is to raise your understanding of drinking water and awareness of the need to protect our drinking water sources. Last year, your tap water met all state drinking water health standards. This report provides an overview of last year’s water quality. Included are details about where your water comes from, what it contains, and how it compares to State standards.
If you have any questions about this report or concerning your drinking water, please contact Department of Public Works Superintendent Ralph Nelson at 457?5321. We want you to be informed about your drinking water. If you want to learn more, please attend any of our regularly scheduled Village Board meetings. The meetings are held the 1st and 3rd Tuesday of each month at 133 Clinton St., Montgomery, NY.
Where does our water come from?
In general, the sources of drinking water (both tap water and bottled water) include rivers, lakes, streams, ponds, reservoirs, springs, and wells. As water travels over the surface of the land or through the ground, it dissolves naturally?occurring minerals and can pick up substances resulting from the presence of animals or from human activities. Contaminants that may be present in source water include: microbial contaminants; inorganic contaminants; pesticides and herbicides; organic chemical contaminants; and radioactive contaminants. In order to ensure that tap water is safe to drink, the State and the EPA prescribe regulations which limit the amount of certain contaminants in water provided by public water systems. The State Health Department's and the FDA's regulations establish limits for contaminants in bottled water which must provide the same protection for public health.
Facts and Figures:
Our water system serves approx. 3,800 people thru approx. 1,400 service connections. The total water produced in 2015 was 93,990,000 gallons. The daily average of water treated and pumped into the distribution system was 257,000 gallons per day. Our highest single day was approx. 422,000 gallons. The amount of water delivered to customers was 85,594,401 gallons. This leaves an unaccounted for total of 8,395,599 gallons in 2015. This water was used to flush mains, fight fires, and was lost to water main breaks. Water customers were charged $3.25 per 1,000 through 49,999 gallons and $3.85 per 1,000 for 50,000 and above. Minimum charge for water is $13.00.
It should be noted that all drinking water, including bottled drinking water, may be reasonably expected to contain at least small amounts of some contaminants. The presence of contaminants does not necessarily indicate that water poses a health risk. More information about contaminants and potential health effects can be obtained by calling the EPA's Safe Drinking Water Hotline (800?426?4791) or the Orange County Health Department at 291?2331.
Are there contaminants in our drinking water?
As the State regulations require, we routinely test your drinking water for numerous contaminants. These contaminants include: total coliform, inorganic compounds, nitrate, nitrite, lead and copper volatile organic compounds, and synthetic organic compounds. The table below depicts which compounds were detected in your drinking water. The State allows us to test for some contaminants less than once per year because the concentrations of these contaminants do not change frequently. Some of our data though representative, are more than one year old. Some of the compounds we analyzed for were detected in your drinking water but below Health Dept. standards. Below is a table of detected contaminants.
Some people may be more vulnerable to disease causing microorganisms or pathogens in drinking water than the general population. Immune-compromised persons, such as persons with cancer undergoing chemotherapy, persons who have undergone organ transplants, people with HIV/AIDS or other immune system disorders, some elderly, and infants can be particularly at risk from infections. These people should seek advice from their health care provider about their drinking water. EPA/CDC guidelines on appropriate means to lessen the risk of infection by Cryptosporidium, Giardia and other microbial pathogens are available from the Safe Drinking Water Hotline (800-426-4791).
Copper;
The level presented represents the 90th percentile of the twenty sites tested. A percentile is a value on a scale of 100 that indicates the percent of a distribution that is equal to or below it. The 90th percentile is equal to or greater than 90% of the copper values detected at your water system. In this case, twenty samples were collected at your water system and the 90th percentile value was the third highest sample taken which was .27 mg/l. The action level for copper was not exceeded at any of the sites tested.
Lead;
The level presented represents the 90th percentile of the twenty sites tested. A percentile is a value on a scale of 100 that indicates the percent of a distribution that is equal to or below it. The 90th; percentile is equal to or greater than 90% of the lead values detected at your water system. In this case, twenty samples were collected at your water system and the 90th percentile value was of the third highest sample taken which was 3.2 ug/l. The action level for lead was not exceeded at any of the sites tested.
Maximum Residual Disinfectant Level ( MDRL): The highest level of a disinfectant allowed in drinking water. There is convincing evidence that addition of a disinfectant is necessary for control of microbial contaminants.
Maximum Residual Disinfectant Level Goal (MRDLG): The level of a drinking water disinfectant below which there is no known or expected risk. MRDLGs do not reflect the benefits of the use of disinfectants to control microbial contamination.
Maximum Contaminant Level (MCL): The highest level of a contaminant that is allowed in drinking water. MCLs are set as close to the MCLGs as feasible.
Maximum Contaminant Level Goal (MCLG): The level of a contaminant in drinking water below which there is no known or expected risk to health. MCLGs allow for a margin of safety.
Action Level (AL): The concentration of a contaminant which, if exceeded, triggers treatment or other requirements which a water system must follow.
Non-Detects (ND): Laboratory analysis indicated that the constituent is not present.
Milligrams per liter (mg/l): Corresponds to one part of liquid in one million parts of liquid (parts per million - ppm).
Micrograms per liter (ug/l): Corresponds to one part of liquid in one billion parts of liquid (parts per billion - ppb).
Picocuries per liter (pCi/L): A measure of the radioactivity in water.
Table of Detected Contaminants
| Contaminant | Violation Yes/No | Date Of Sample |
Level Detected (Maximum or Range) |
Unit Measure-ment | MCLG |
Regulatory Limit (MCL-TT or AL) |
Likely Source of Contamniation |
| Lead | No | June 2013 | 90th = 3.2 | ug/l | 0 | AL = 15 | Corrosion of household plumbing systems |
| July 2013 | Range = ND - 9.1 | ||||||
| Copper | No | June 2013 | 90th = 0.27 | mg/l | 1.3 | AL = 1.3 | Corrosion of household plumbing systems |
| July 2013 | Range = .014 - .49 | ||||||
| Nitrate | No | May 12, 2015 | average = 1.15 | mg/l | 10 mg/l | 10 mg/l | Run-off from fertilizer use |
| range= 0.04 - 2.7 | |||||||
| Total Trihalomethanes | No | August 6, 2015 | 33 | ug/l | N/A | 80 ug/l | By-product of drinking water chlorination needed to kill harmful organisms. TTHs are formed when source water contains large amounts organic matter. |
| Haloacetic Acid | No | August 6, 2015 | 19.5 | ug/l | N/A | 60 ug/l | Formed when source water contains large amounts of organic matter |
| Nickel | No | August 18, 2015 | Average = 2.13 | ug/l | N/A | 100 | Naturally occuring |
| Range = 1.6-2.5 | |||||||
| Barium | No | August 18, 2015 | Average = 83.7 | ug/l | 2,000 | 2,000 | Naturally occuring |
| Range = 37-150 | |||||||
| Combined Radium | No | May 9, 2013 | Average = 0.92 | pci/L | 0 | 5 | Erosion of natural deposits |
| Range = 0.87 - 1.01 | |||||||
| Uranium | No | May 9, 2013 | Average = 1.21 | ug/l | 0 | MCL = 30 | Erosion of natural deposits |
| Range = 1.06 to 1.4 | |||||||
| Sodium | No | July 14, 2015 | Average = 52 | mg/L | N/A | See Note 1 | Road Salt |
| Range = 33 - 63 | |||||||
| Manganese | No | April, May, Dec 2015 | Average = 97 | mg/L | N/A | 300 | Naturally occurring |
| Range = 44 - 200 | See Note 2 |
Note 1: Water containing more than 20 mg/l of sodium should not be used for drinking by people on severely restricted sodium diets. Water containing more than 270 mg/l of sodium should not be used for drinking by people on moderately restricted diets.
Note 2: The Food and Nutrition Board of the National Research Council determined an estimated safe and adequete daily dietary intake of manganese to be 2,000-5,000 micrograms for adults. However, many peoples diets lead them to consume even higher amounts of manganese, especially those who consume high amounts of vegetables or are vegetarian. The infant population is of greatest concern. It would be better if the drinking water were not used to make infant formula since it already contains iron and manganese. Excess manganese produces a brownish color in laundered goods and impairs the taste of tea, coffee, and other beverages. Concentrations may cause a dark brown or black stain on porcelain plumbing fixtures. As with iron, manganese may form a coating on distribution pipes. These may slough off, causing brown blotches on laundered clothing or black particles in the water.
Ralph Nelson
Superintendent of Public Works
 Read full Article from midhudsonnews.com ~~~~~~~~ The governor also announced two $4.5 million New York Forward